At Houzz, we use automatic testing to ensure that the Houzz App is stable and bug free. With time, the automation test suite has gotten larger, and more comprehensive. As developers, we wanted to measure how much of our code is being tested and to understand what scenarios are accounted for, which not, and what additional automated testing to add. To do this, we used Code Coverage. It is common practice to use Jacoco on Android, specifically, but it’s integration into Jenkins and a continuous integration system is far from simple.
In this article, I will demonstrate how to integrate code coverage into Jenkins automated continuous integration using a simple Android app. The full code of this post can be found on github.
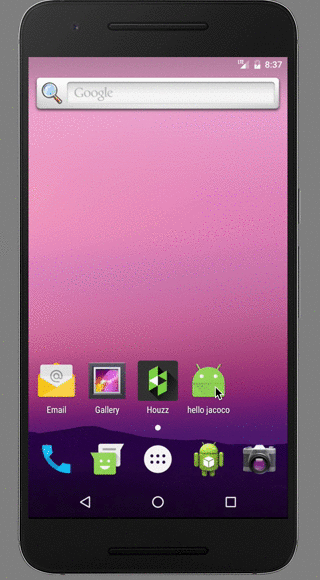
Simple Demo Project
I made an app that contains a screen with one button. Clicking on the button causes the text to appear.
Unit Testing
To test this app, I chose to use the Espresso framework. This framework is the official framework for Android unit testing. Other frameworks that can be used include Robotium and UIAutomator.
The scenario covered by the test is that a click on the “Hello World!” button causes the “I am alive!” text to appear.
Here is the code:
@RunWith(AndroidJUnit4.class)
public class ExampleInstrumentedTest {

    @Rule
    public ActivityTestRule mActivityRule = new ActivityTestRule(MainActivity.class);

    @Test
    public void checkButton() {
        onView(withId(R.id.button)).perform(click());
        onView(withId(R.id.textview)).check(matches(withText(R.string.i_am_alive)));
    }
}
Running this code makes a click on the button and, once the text is verified to match the required test, the text to appear.
Adding Code Coverage
Now for the code coverage. To add the code coverage to the app we need to add this line to the build.gradle:
buildTypes {
    debug {
        testCoverageEnabled true
    }
}
This will add the code coverage to our code (done automatically).
Another line we should add is the version of JaCoCo that we want to use. I chose the 0.7.5.201505241946 version because the JaCoCo plugin for Jenkins is configured to use this version (at the date of writing this post).
apply plugin: 'jacoco'
jacoco {
    toolVersion = '0.7.5.201505241946'
}
Building
When running a UI test on the emulator or device the gradle builds two apk files, one for the app, and one for the testing code. Let’s build both the app and the testing app and install them.
First connect a device or an emulator, and type in the command line in the project folder:
./gradlew clean installDebug installDebugAndroidTest
This command will:
– clean the build folder
– compile and install the app on the device
– compile and install testing app on the device
Running Test with Code Coverage
Now for the fun part. Run the tests from command line:
adb shell am instrument -w -r -e coverage true  -e debug false -e \
class houzz.com.hellojacoco.ExampleInstrumentedTest#checkButton \
houzz.com.hellojacoco.test/android.support.test.runner.AndroidJUnitRunner
Let’s explain the above command first:
– “adb shell am instrument -w” runs all the UI tests
– “-e coverage true” tells the runner to run the UI tests in a code coverage mode. By default, the code coverage results file will be saved in a /data/coverage.ec file, unless overridden by coverageFile flag.
– “-e debug false” is because we don’t want to debug the testing
– “-e class houzz.com.hellojacoco.ExampleInstrumentedTest#checkButton houzz.com.hellojacoco.test/android.support.test.runner.AndroidJUnitRunner” this tells our app to run a specific test
An example output is:
INSTRUMENTATION_STATUS: numtests=1
INSTRUMENTATION_STATUS: stream=houzz.com.hellojacoco.ExampleInstrumentedTest:
INSTRUMENTATION_STATUS: id=AndroidJUnitRunner
INSTRUMENTATION_STATUS: test=checkButtonINSTRUMENTATION_STATUS: \
class=houzz.com.hellojacoco.ExampleInstrumentedTestINSTRUMENTATION_STATUS: current=1
INSTRUMENTATION_STATUS_CODE: 1
INSTRUMENTATION_STATUS: numtests=1
INSTRUMENTATION_STATUS: stream=.
INSTRUMENTATION_STATUS: id=AndroidJUnitRunner
INSTRUMENTATION_STATUS: test=checkButtonINSTRUMENTATION_STATUS: \
class=houzz.com.hellojacoco.ExampleInstrumentedTestINSTRUMENTATION_STATUS: current=1
INSTRUMENTATION_STATUS_CODE: 0
INSTRUMENTATION_RESULT: stream=
Time: 1.621
OK (1 test)
Generated code coverage data to /data/user/0/houzz.com.hellojacoco/files/coverage.ec
INSTRUMENTATION_RESULT: coverageFilePath=/data/user/0/houzz.com.hellojacoco/files/coverage.ec
INSTRUMENTATION_CODE: -1
The output of this whole process is represented as a “raw” file that stores the coverage results file – coverage.ec. Notice at the end of the output of the command to the next line:
Generated code coverage data to /data/user/0/houzz.com.hellojacoco/files/coverage.ec
You won’t find it if you search in your computer. That is because this file is saved on the device. We need another command to pull the file from the device.
adb pull /data/user/0/houzz.com.hellojacoco/files/coverage.ec
Using the Coverage File
Now we have a binary file, and in our case it’s 4.0K in size. But what should we do with it?
This is the part where most developers get stuck. I dived into the Jacoco projects code and found a ReportGenerator.java file. This class generates a report for an Eclipse project style, so I changed the code a bit and exported a jar that will fit our needs.
Executing the jar is simple:
java -jar android-jacoco-the-missing.jar -f /path/to/coverage.ec -p ./hellojacoco
And it will generate a folder named coveragereport/ one level above project’s folder. (this can be changed with the -r flag)
So let’s dive into it and see the report in the index.html file:

What we see here is the package of our app. When we dive in we can elaborate on specific code coverage metrics. Clicking on the link brings you into:

Here are all the classes that we tested. One is the main activity, while the second is an anonymous class of a OnClickListener. We can see that we have a 90% coverage. Clicking on the MainActivity link gets us into:

What we see here is all the line that the test visited highlighted in green. If a line is not covered it is highlighted in red. If a “if” clause is passed with one result (true or false) it is highlighted with yellow color.
Using the Jenkins Plugin
For those who use Jenkins as part of their building process, there is a another option in order to process the coverage binary file. In this case you can install the JaCoCo plugin for Jenkins. After installing it, you need to configure it in the project. We need to go to the post build section and add “Record JaCoCo coverage report”:

I recommend to add this line to the exclusions section:
 **/R.class,**/R$_.class,__/BuildConfig._,_<em>/Manifest_. \
</em>,_<em>/_Test</em>._,android/__/_.
This will make android ignore those generated files.
And now you have a code coverage integrated into your Jenkins build system. You will now be able to monitor your test coverage and determine which features need more testing. Happy testing!